Productivity of cotton and sorghum in an agroforestry system of shea trees (Vitellaria paradoxa gaertn) in northern Benin ()
1. INTRODUCTION
The presence of trees among crops creates landscapes known as “agroforestry landscapes” [1]. The benefit of integrating trees into farming systems has been highlighted [2,3]. Shea parklands, for instance, help maintain soil fertility and the sustainability of cropping systems [4]. In fact, the biomass produced by the trees is broken, allowing recycling of nutrients pumped by the shaft depth horizons to the surface soil. In Benin, the combination of shea with other crops on shea parklands is common [5]. The effects of intercropping shea trees with other crops appears to be contradictory. According to some authors [3], crop yields are better [1] or worse [6,7] under the tree’s zone of influence. The combination of cotton, sorghum and shea is one of the most common farming systems in northern Benin [8]. Cotton and shea nuts contribute considerably to the country’s economy and are first and third among export products, respectively. Sorghum ensures food security for much of the population and is one of the most cultivated cereals in the study area. It is therefore necessary to conserve this tree-cropping system and improve its productivity. In Africa, research has been carried out on the subject, namely by [1] in Burkina Faso, [9] on the influence of shea on crop yields in Côte d’Ivoire; and [10] on the influence of Faidherbia albida on cotton in Cameroon. In Benin, [7] has studied the influence of shea tree shading on cotton yields. The influence of shea tree shading on plant height and yield of other crops other than cotton is not known. The objective of this study is to assess the influence of the shea tree crown on productivity (height, yield, fresh biomass) of cotton and sorghum in northern Benin.
2. METHODOLOGY
2.1. Study Environment
The study was conducted in two villages in two communes (Figure 1.) in the northern Benin: Gounarou (10˚47'655''N and 2˚48'610''E) in Gogounou commune and Tomboutou (11˚84'306''N and 3˚24'966''E) in Malanville commune. The village of Gounarou is characterized by a relatively flat topography, an average annual rainfall of 1200 mm distributed over a rainy season from May to October and an average crop cycle of 150 days. The temperature ranges between 18˚C and 38˚C especially in the dry season. Gogounou commune is watered by two (02) major rivers and their tributaries belonging to the Niger River Basin. It is the Sota and Alibori located respectively in the East and the West. Soils are those of gneissic granite base for most ferruginous and generally suitable for agriculture. In floodplains, alluvial soils dominate, clayey-sandy rich enough due to the addition of organic matter by the annual high water rivers. The main crops in Gounarou are cotton, maize, sorghum, yams; livestock products are also prevalent. Fallow periods last from 5 to 10 years or more. The Bariba are the dominant ethnic group.
The village Tomboutou has a more open landscape, characteristic of the Sahel. Average annual rainfall is 900 mm with a cropping period of 120 days. The temperature varies from 16˚C to 20˚C. The Malanville commune soils are more tropical ferruginous soils or less hydromorphic sol developed on the sandstone or alluvium of Niger. Some very gravelly ferruginous tropical soils and raw mineral soils on armor are also found in the commune. The area is dominated by cereal production: rice, sorghum, millet. Groundnuts, market vegetables (tomatoes, peppers, okra, potato, onion), cotton and cassava are cultivated. Livestock production and fishing is also common. Crops are harvested from November to December or January, and crop residues (sorghum and cotton stalks) are left on the field for grazing. Large quantities of sorghum straw are harvested for domestic use (fences, soap production). Pressure on natural resources is evident in Tomboutou, where fallow periods are very short (1 - 2 years) and conflicts between farmers and herders frequent. Tomboutou borders the international market of the Commune of Malanville, which sees a great deal of market activity.
2.2. Influence of Shea on Productivity of Cotton and Sorghum
2.2.1. Experimental Design and Data Collection
The experimental design consists of shea trees, cotton and sorghum. Two criteria were used to select sample shea trees: the combination of shea with cotton or sorghum in more or less homogeneous soils, and the width of the tree crown, broken down into three categories of crown diameter: 4 - 8 metres; 8 - 10 metres and <10 metres. A local variety of sorghum called red sorghum (dobi in Bariba) was used in Gounarou; early white sorghum (henniwasso in Dendi) was used in Tomboutou. The cotton variety grown in the two villages was the improved variety H 279-1, sown at 0.80 m on the row and 0.40 m between rows and thinned to two plants per hill. The spacing of the sorghum plants is 1 m on the row and 0.90 m between rows; they were not thinned. In each crown category, 3 trees intercropped with cotton and sorghum were randomly selected among the 18 to 21 farms in each of the two villages. In all, nine trees were used for experimentation, per crop and per village.
A North-South transect and East-West transect were created around each sample tree. The transects demarcated two zones of shade influence: the area under the crown and outside the crown. Data was collected with a radius of 0.5 m from the crown and 1.5 m from the crown (Figure 2). Thus, at each measuring position, a 1 m square was demarcated, to measure the cotton and sorghum plants. Data was collected for plant height of cotton and sorghum, biomass weight of residues per crop and the number of cotton buds.
2.2.2. Statistical Analysis
Variables were subjected to analysis of variance, partial hierarchical model with 5 factors including: site or village (fixed factor), crown category (fixed factor), distance from tree (fixed factor), direction (fixed factor), sorghum or cotton plant (subordinate to the four other factors). Adjusted means were calculated for the different levels of factors and interaction plots were generated for significant interactions between factors.
3. RESULTS
3.1. Influence of the Tree Crown on Sorghum Productivity
ANOVA results for the effects of various factors on sorghum yields revealed highly significant differences between the factors Site and Position, as regards the height of sorghum plants and fresh biomass (Table 1). The crown diameter and direction of the sorghum plant have no significant effect on plant height but do significantly influence the amount of fresh biomass. Table 2 presents the means of the various productivity parameters for sorghum, according to the different positions (outside the influence and under the influence). This table reveals that, because of their crown, shea trees reduce sorghum yields under canopy in shea parklands. Indeed the average height of sorghum plants is reduced by 9.75%, while fresh biomass is reduced by 29.31%. The influence of the shea tree canopy on sorghum height depends on the diameter of the crown and vice versa (Table 1). This interaction crown diameter (m) and position is illustrated in Table 3. This table shows significantly higher heights for plants outside the crown’s zone of influence (3r/2) than those under the influence (r/2).
A description of the effects of the different interactions is presented in Figure 3. This figure reveals that fresh biomass per m2 is greater in Tomboutou than Gounarou. Also, plants located in the shea tree’s zone of influence are generally less productive than those located outside the zone. However, the crown diameter is influenced by the site: in Gounarou, the effect of the crown’s width on sorghum yields is negligible while in Tomboutou, plant biomass increases with the average width of the shea tree

Figure 2. Experimental design for data collection.

Table 1. Results of the five-factor analysis of variance for sorghum plant height and fresh biomass.

Table 2. Adjusted mean and standard error (se) of plant height and fresh biomass for sorghum according to the position.
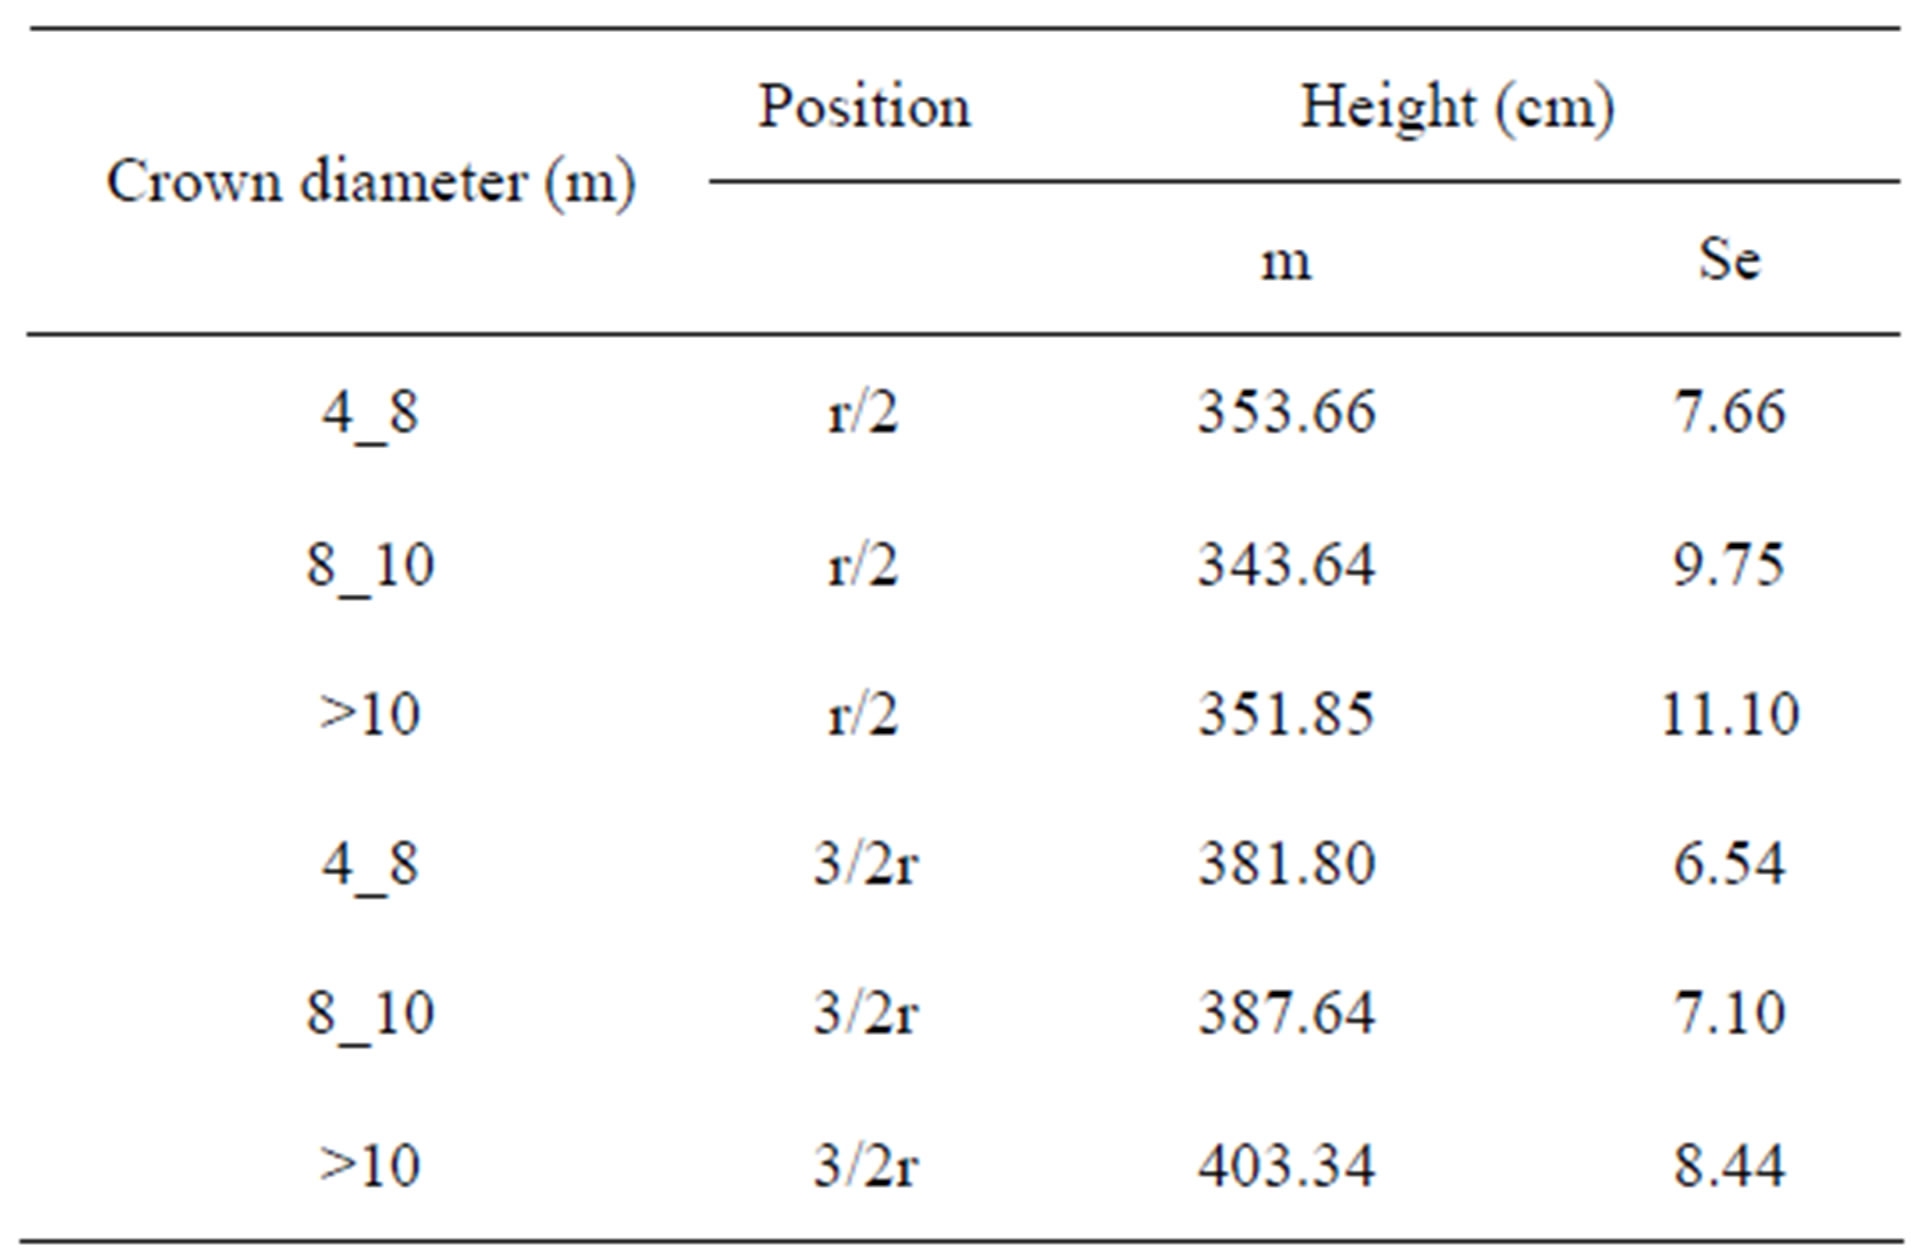
Table 3. Adjusted mean and standard error (se) of plant height for sorghum (H in cm) according to the crown diameter and position.
canopy. This latter observation holds true regardless of the position of the sorghum plants and their direction relative to the tree.
3.2. Influence of the Tree Crown on Cotton Productivity
Table 4 presents ANOVA results for the effects of different factors on the height of cotton plants, the number of buds and fresh biomass. This table shows that all the parameters vary significantly according to the various factors except the direction of the plants, which does not affect plant height. Table 5 presents the means of the various productivity criteria for cotton, according to the different positions (outside the influence and under the influence). This table shows that because of their crownshea trees reduce cotton bud yields under canopy in sheaparklands in Gounarou and Tomboutou in northern Benin. Indeed the average height of cotton plants is reduced by 6.58% under the crown’s influence, while the number of buds per plant drops 13.06% and fresh biomass reduces by 36.06%. Moreover, only the paired interactions site with crown diameter and site with plant position are significant, as well as crown diameter with direction.
A description of the statistically significant interactions is shown in Figure 4. In Tomboutou, crown diameter

Table 4. Results of five-factor analysis of variance for five plant height, number of buds and fresh biomass for cotton.
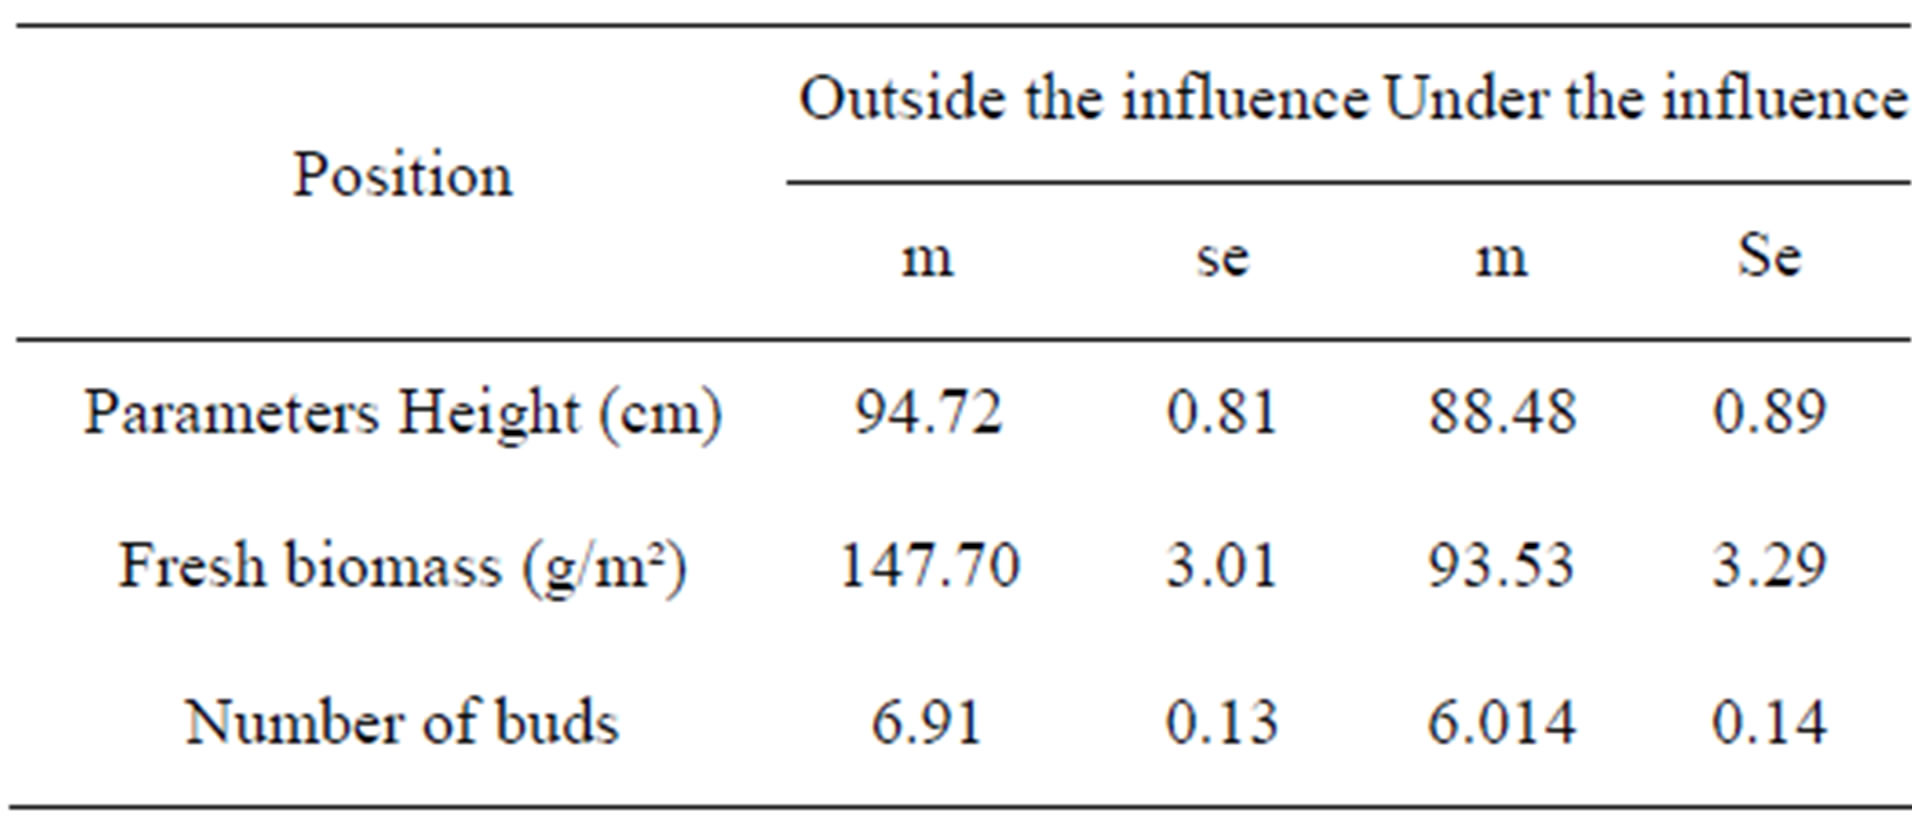
Table 5. Adjusted mean (m) and standard error (se) for plant height and fresh biomass of sorghum according to position.
does not have a significant effect on plant height, but the position of the plants does: cotton plants grown outside shea trees’ zone of influence are significantly taller. However, in Gounarou, there is no significant effect for the position of plants. In addition, shea trees with larger crown widths (<10 m) negatively affect the height of cotton plants. With regard to direction, a wide crown is found to negatively affect plant height, except for a western orientation, where the difference is not noticeable.
Figure 5 Illustrates interactions between the different